
In this note
Significance summary
A rising month, and a path worth publishing.
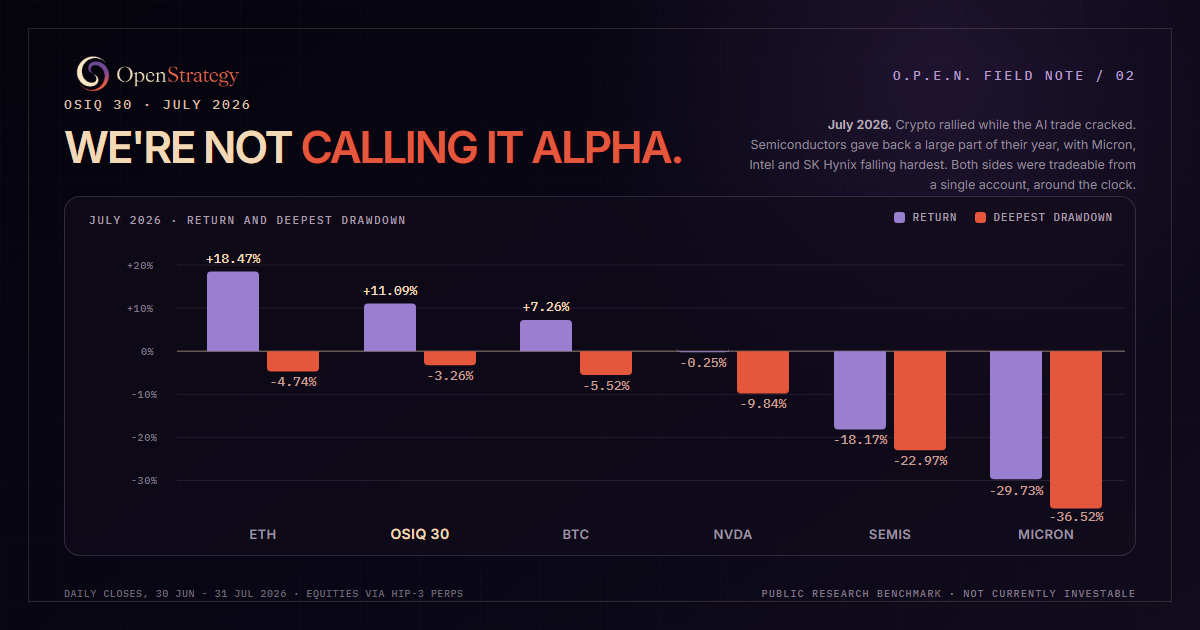
OSIQ 30 returned 11.09% in July while BTC returned 7.26% and ETH 18.47%. In a rising month, a basket of crypto-native strategies rose with the market, and that is the honest description of the return. The figure worth publishing is the path: a deepest drawdown of 3.26%, against 22.97% for semiconductors and 36.52% for Micron over the same days.
The return
In a rising month, the honest word is participated.
OSIQ 30 returned 11.09% in July. BTC returned 7.26%. ETH returned 18.47%.
We won’t dress that up. In a month when crypto rose, a basket of crypto-native strategies rose with it. The honest word for that is participated.
The number worth publishing is the other one.
What July looked like everywhere else
The most crowded trade of 2026 drew down 22.97%.
The AI trade cracked. Measured on the same daily closes over the same period, semiconductors fell 18.17% and drew down 22.97%. Micron fell 29.73% with a 36.52% drawdown. Intel fell 35.88% with a 41.69% drawdown. SK Hynix fell 37.28% with a 45.25% drawdown. Even NVDA, which finished the month roughly flat at −0.25%, drew down 9.84% along the way.
The Nasdaq 100 fell 7.07%. The S&P 500 finished at −0.34%, with a 2.98% drawdown — shallower than this Index’s.
Set against that, BTC added 7.26% and ETH 18.47%, with drawdowns of 5.52% and 4.74%.
None of this was a collapse in the year’s terms. Semiconductors entered July after an extraordinary run. What happened was a drawdown — a fast one, in the most crowded trade of 2026.
Why that matters here
Since HIP-3, the falling side and the rising side share one venue.
Those markets are not somewhere else. Since HIP-3, NVDA, TSLA, AAPL, MSFT, MU, INTC, SMH and index perps trade on Hyperliquid alongside the crypto book, around the clock. By April, equity perps were roughly 27% of open interest and 42% of volume.
So the thirty strategies in this Index were not running in a crypto-only market in July. The falling side and the rising side were available in the same account, on the same margin. That makes a return harder to interpret, not easier.
It also means the comparisons above are drawn from the same venue and the same daily closes as the Index itself, rather than from a different market on a different clock.
The number we’d defend
A 3.26% deepest drawdown, while one in ten constituents was breaching.
OSIQ 30’s deepest drawdown in July was 3.26%, from 113.94 on 23 July to 110.23 on 30 July.
Three of the thirty strategies drew down more than 25% in the same month. Each breached the Index’s risk limits, was removed as of that observation’s close, and contributed no return from the following interval.
Eleven percent in a rising month proves little. Eleven percent while one in ten constituents was breaching, in a month when the sector next door on the same venue drew down 22.97%, says something about construction and about the rules running underneath it.
Return is the number everyone publishes. The path is the number almost nobody does.
All Index figures use the final published daily observation series. The aggregate CSV record and JSON record are available from the public Index page.
What this record cannot tell you
Five things one rising month does not establish.
It does not separate crypto beta from anything else. No part of the 11.09% should be read as manager skill.
Drawdowns are measured from one scheduled observation a day. Intraday losses may have been larger.
Equity and index figures are taken from HIP-3 perpetual markets on Hyperliquid, not from the primary listing venues. Perpetual prices track their underlying but are not identical to it, and they trade when the underlying market is closed.
One month is not a base rate. Three removals in July says nothing reliable about August.
Nothing here establishes capacity, liquidity, accessibility or implementation feasibility for any constituent.
What to watch
The first falling month is the informative one.
July was a rising month for crypto. The more informative month is the first falling one — whether this drawdown stays contained once the beta stops helping.
Method and limitations
How to interpret the observation.
OSIQ 30 uses equal-weight Index construction and flow-adjusted, time-weighted constituent returns. The public record is based on official selected-strategy activity evidence. Constituent identities and cloneable thresholds are not published.
All comparison figures are computed from daily closes between the 30 June close and the 31 July close. Returns are close-to-close; drawdowns are the deepest peak-to-trough move on that same daily series. BTC and ETH are Hyperliquid perpetual markets. NVDA, MU, INTC, SKHX, SMH, the Nasdaq 100 and the S&P 500 are HIP-3 perpetual markets on Hyperliquid.
Index inclusion does not constitute an O.P.E.N. Profile, human-reviewed Strategy Passport assessment, investment recommendation, institutional approval or conclusion that a strategy is accessible or investable.
OSIQ 30 is a public research benchmark and is not currently investable.
Citation format
Cite this Index Research note.
Jun Hao, Teo. “We’re Not Calling It Alpha.” OpenStrategy Research, 3 August 2026, updated 3 August 2026. Data through 1 August 2026, 00:05 UTC scheduled observation. https://openstrategy.trade/research/index/monthly-note-2026-07/